In this story
Kritin Vongthongsri
Cofounder @ Confident AI | Empowering LLM practitioners with Evals | Previously AI/ML at Fintech Startup | ML + CS @ Princeton

What is LLM Observability? - The Ultimate LLM Observability Guide

November 2, 2024
·
9 min read
Presenting...
The open-source LLM evaluation framework.
Star on GitHub
What is LLM Observability? - The Ultimate LLM Observability Guide

After months of intense evaluation, red teaming, and iterating on hundreds of prompts for your LLM application, launch day is finally here. Yet, as the final countdown ticks away, those familiar doubts lingers: Have you truly covered all the bases? Could someone find an exploit? Is your model really ready for the real world? No seriously, is it really ready?

The truth is, no matter how thorough your preparation is, it’s impossible to test for every potential issue that could occur post-deployment. But here’s the good news — you’re not alone. With the right LLM monitoring, oversight, and observability tools, you can effectively manage and mitigate those risks, ensuring a smoother path ahead, which brings us to LLM observability.

By the end of this article, you'll be equipped with all the knowledge you need to empower your LLM application with observability. Let's begin.

What is LLM Observability?

LLM observability provides teams with powerful insights to keep LLMs on track, ensuring they perform accurately, stay aligned with business goals, and serve users effectively. With the right observability tools, you can monitor LLM behavior in real-time, A/B test different LLMs in production, easily detect performance shifts, and preemptively address issues before they impact the business or user experience. It’s a proactive approach to managing LLM applications that allows you to troubleshoot faster, maintain LLM reliability, and confidently scale your GenAI-driven initiatives.

While LLM monitoring refers to tracking and evaluating various aspects of your LLM application in real-time, such as user inputs, model responses, latency, and cost, LLM observability on the other hand, provides deeper insights by giving full visibility into all the moving parts of the system, enabling engineers to debug issues and operate the application efficiently and safely. This concept of having full visibility into all components of your LLM pipeline, is often enabled by LLM tracing.

In a nutshell, here are the three key terminologies you ought to know:

  • LLM monitoring: This involves continuously tracking the performance of LLMs in production. Monitoring typically focuses on key metrics like response time, error rates, and usage patterns to ensure that the LLM behaves as expected and to identify any performance degradation or service issues that need attention.
  • LLM observability: This goes beyond monitoring to provide in-depth insights into how and why an LLM behaves the way it does. Observability tools collect and correlate logs, real-time evaluation metrics, and traces to understand the context of unexpected outputs or errors in real-time.
  • LLM tracing: Tracing captures the flow of requests and responses as they move through an LLM pipeline, providing a timeline of events from input to output. This granular view allows developers to track specific inputs, intermediate processing stages, and final outputs, making it easier to diagnose issues, optimize performance, and trace errors back to their root causes.

I'll be showing examples for each one of them in later sections but first, we'll discuss why LLM observability is imperative to productionizing LLM applications.

Why Is LLM Observability Necessary?

LLM observability helps many critical problems. Here are a few of them and why picking the right observability tool is so important.

LLM applications Needs Experimenting

No one gets it right the first time, which is why even when you've deployed to production you'll want to A/B test different LLMs to see which best fits your use case, use a different prompt template, or even use a whole different knowledge base as additional context to see how the responses change. This is why you definitely want a way to easily "replay" or recreate scenarios of which the responses were generated in.

LLM applications are Difficult to Debug

You've probably heard of root-cause analysis, and the unfortunate news is this is extremely difficult to do for LLM apps. LLM apps are made up of all sorts of moving parts — retrievers, APIs, embedders, chains, models, and more — and as these systems become more powerful, their complexity will only increase. Monitoring these components is key to understanding a range of issues: what’s slowing down your application, what might be causing hallucinations, and which parts may be unnecessary. With so much that could go wrong, gaining visibility into these areas is essential to keep your system efficient, effective, and bug-free.

Possibilities are Infinite with LLM responses

You can spend months curating the most comprehensive evaluation dataset to thoroughly test your LLM application, but let’s face it: real users will always surprise you with something unexpected. The range of possible queries is endless, making it impossible to cover everything with complete confidence. LLM observability enables you to automatically detect these unpredictable queries and address any issues they may cause.

LLMs can Drift in Performance

LLM applications are inherently non-deterministic, meaning you won’t always get the same output for the same input. Not only are they variable, but state-of-the-art models also evolve constantly, especially when working with third-party providers like OpenAI or Anthropic. This can lead to undesirable hallucinations and unexpected responses even after deployment. While testing LLMs during development is important, it’s simply not enough — continuous monitoring is essential as long as LLMs remain unpredictable and keep improving.

LLMs tend to Hallucinate

Hallucinations occur in LLM applications when they generate incorrect or misleading information, especially when faced with queries they cannot accurately address. Instead of indicating a lack of knowledge, these models often produce answers that sound confident but are fundamentally incorrect. This tendency raises concerns about the risk of spreading false information, which is particularly critical when LLMs are used in applications that require high factual accuracy.

Confident AI: The LLM Evaluation Platform

The all-in-one platform to evaluate and test LLM applications on the cloud, fully integrated with DeepEval.

Regression test and evaluate LLM apps on the cloud.
LLM evaluation metrics for ANY use case.
Real-time LLM observability and tracing.
Automated human feedback collection.
Generate evaluation datasets on the cloud.
LLM security, risk, and vulnerability scanning.

What Do You Need in an LLM Observability Solution?

There are five uncompromisable features that are must-haves for any LLM observability tool. The five core pillars of LLM observability are:

  1. Response Monitoring — Tracking user queries, LLM responses, and key metrics like cost and latency in real-time.
  2. Automated Evaluations — Automatically evaluating monitored LLM responses.
  3. Advanced Filtering — Filtering for failing or undesirable responses to flag them for further inspection.
  4. Application Tracing — Tracing connections between components of your LLM application to identify bugs and bottlenecks.
  5. Human-in-the-Loop — Providing human feedback and expected responses for flagged outputs.

With these five pillars, LLM observability tools can help any stakeholders understand how the application is performing and identify areas that need improvement — whether you’re a software engineer, data scientist, human reviewer, domain expert, or even CEO.

LLM Observability Overview

Response Monitoring

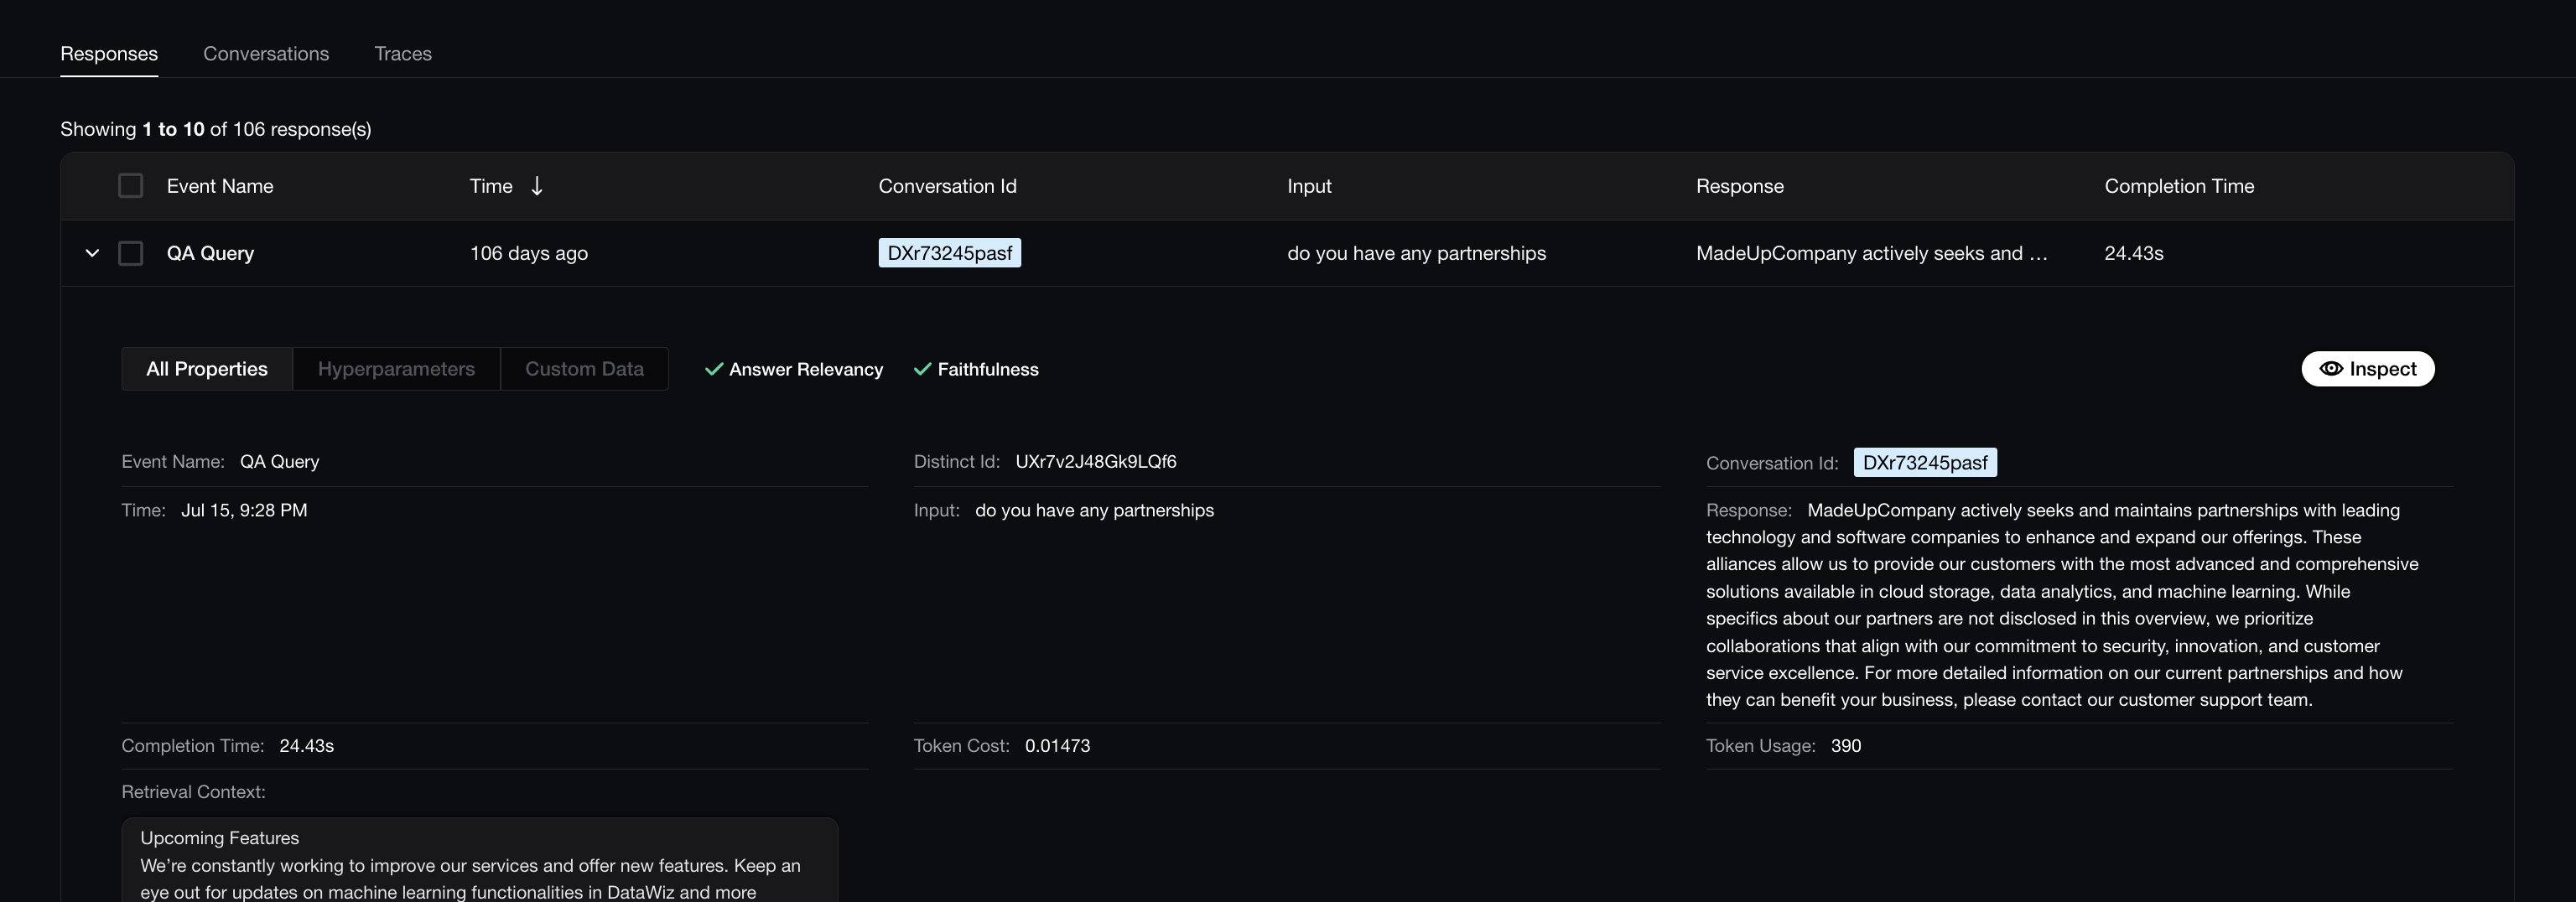
Response monitoring is the cornerstone of LLM observability. It involves tracking key attributes and metrics associated with each user interaction and can be divided into five main areas:

  1. Tracking User Input–LLM Response Pairs: These are the most essential parameters to track, as they’re used not only for evaluation but also represent what users see and will be the primary focus for domain experts and reviewers. In RAG applications, this includes the retrieval context.
  2. Tracking Key Metrics: Tracking metrics like completion time (latency), token usage, and cost helps ensure your system stays efficient.
  3. Tracking User IDs and Conversation IDs: Associating responses with user and conversation IDs makes it easy to manually inspect individual user interactions and conversation threads.
  4. Tracking Hyperparameters: Tracking hyperparameters such as model, prompt template, and temperature allows you to compare how different versions of your model perform.
  5. Tracking Custom Data: The ability to monitor additional data as needed is also valuable for meeting use-case-specific requirements.
What an LLM Observability Solution should be Monitoring

Ultimately, tracking User Input–LLM Response Pairs and key metrics forms the foundation of effective response monitoring. Monitoring user and conversation IDs allows reviewers to examine specific interactions, while tracking hyperparameters and custom data provides insights into whether your adjustments are making a positive impact.

Advanced Filtering

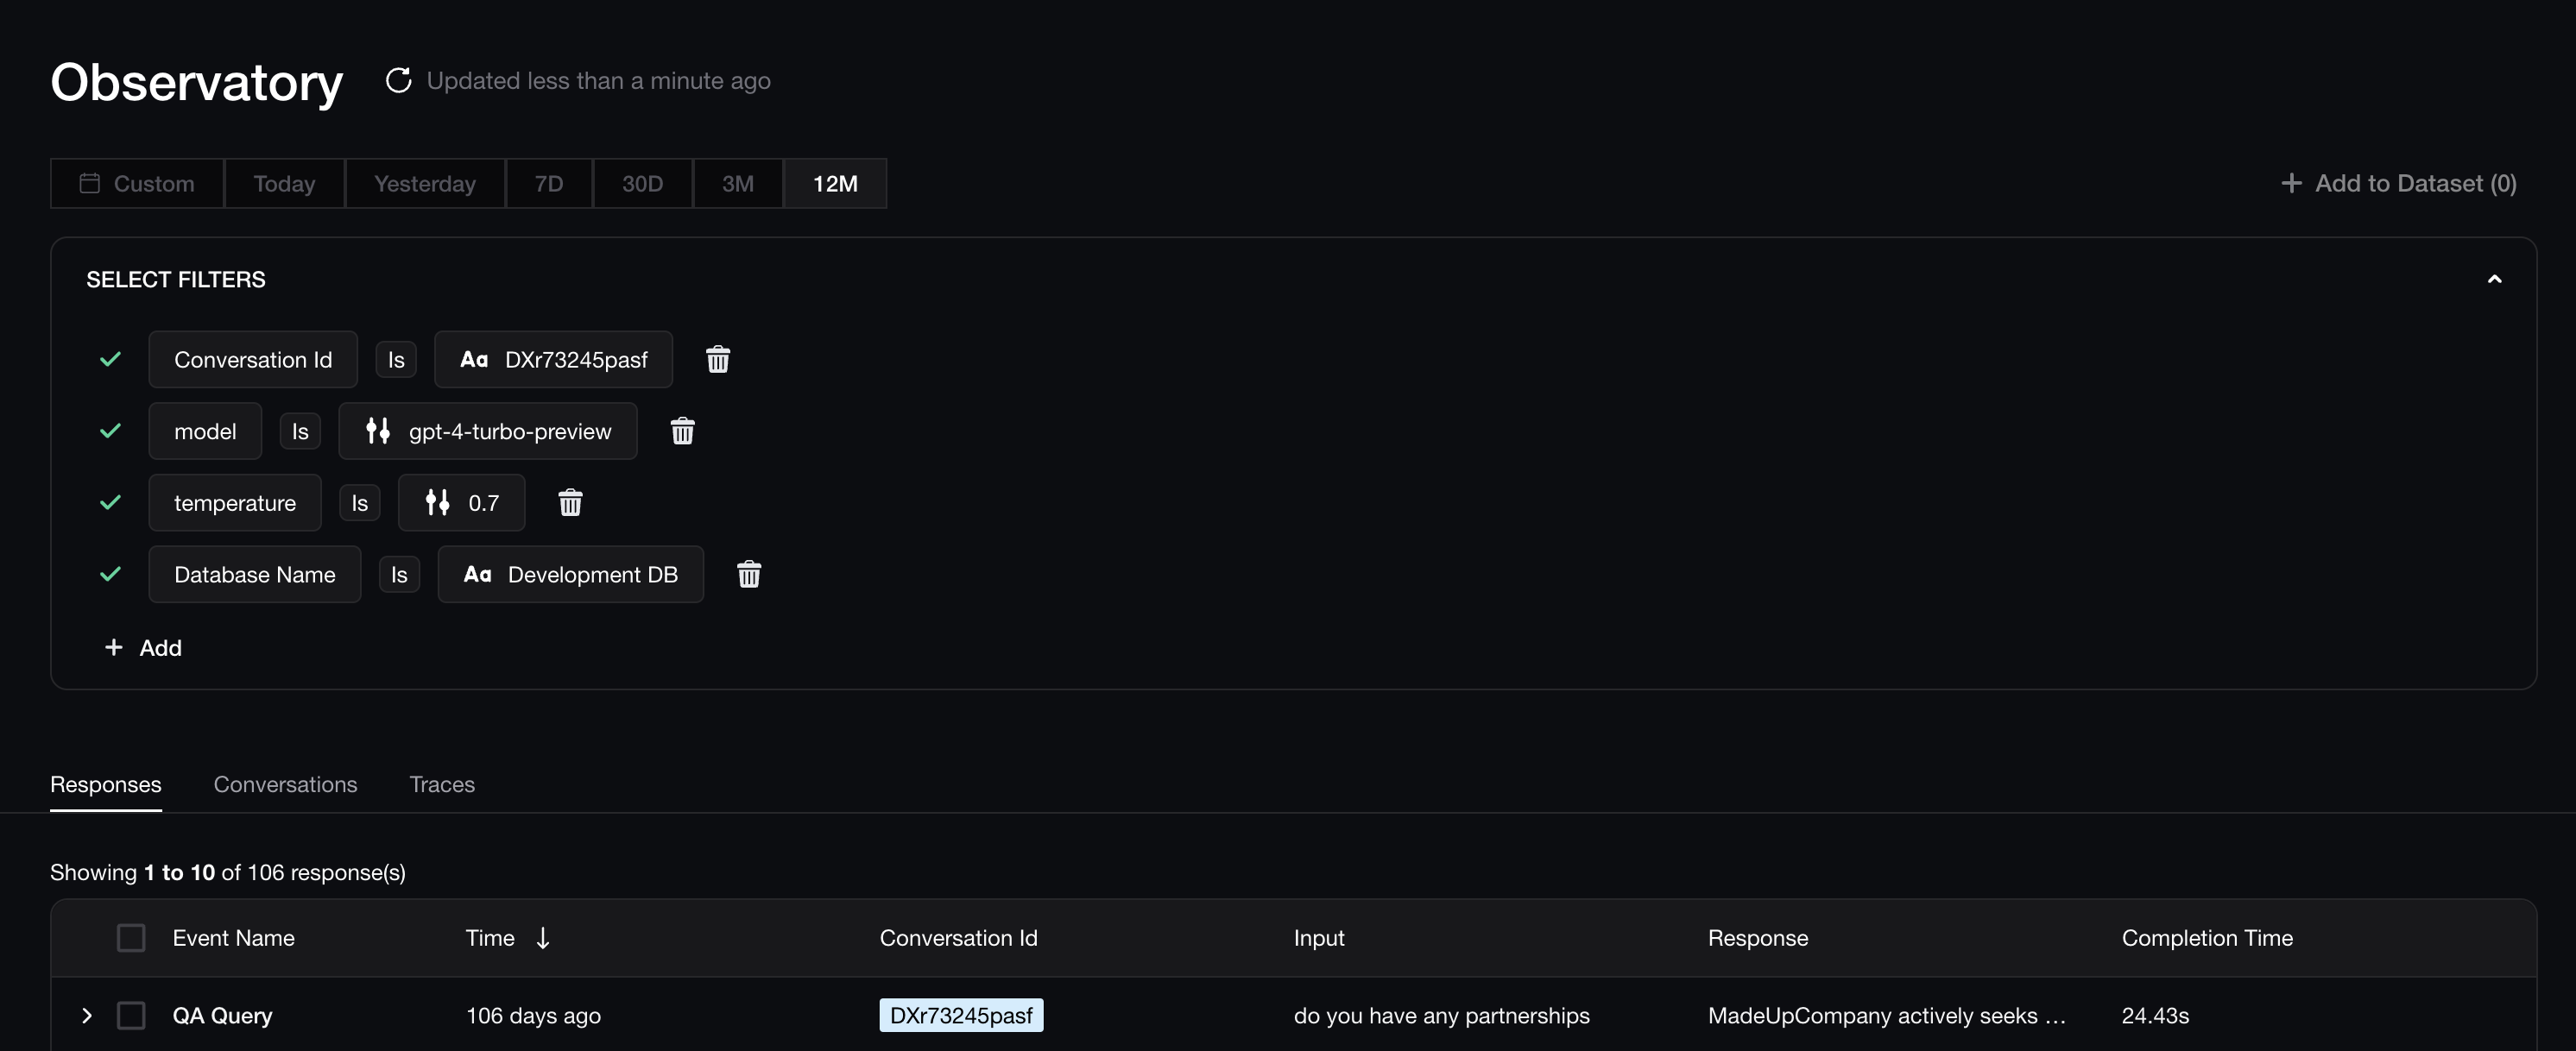
Advanced filtering capabilities are essential for efficiently identifying and analyzing LLM responses. While filtering for failed evaluations is crucial for prioritizing responses that need further inspection, there are additional filtering options that can greatly enhance your analysis. Consider the following RAG chatbot example, where you're able to recreate the scenario where the LLM responses were generated by the "gpt-4-turbo-preview" model, with a temperature of 0.7, for a specific conversation Id, where the retrieval context was retrieved from the "Development DB" database:

How Filtering Works on Confident AI

This is extremely important because it allows you to gain insights into the quality of responses generated under various production settings, which makes it perfect for A/B testing and catching regressions. To go through them in depth:

  • Filtering by User ID or Conversation Thread: Filtering interactions from a specific user or conversation thread allows you to assess model performance across multiple responses from that user. This is especially useful for identifying issues such as malicious behavior, problematic interactions, and repeated failures within a conversation or specific topic.
  • Filtering by Hyperparameters: If you’re managing multiple versions of your LLM application, filtering by these settings (e.g. model, prompt template) enables you to compare responses across configurations. This helps you evaluate which adjustments are effective and which may need further refinement.
  • Filtering by Custom Data: This is similar to hyperparameters, but since not everything is a hyperparameter, such as which knowledge base your LLM application is using for example, the additional information can go here.
  • Filtering by Human Feedback: Sometimes, a single review isn’t enough — you might want a second opinion on failed metrics, or as a stakeholder, you may want to assess the quality of human reviews. Filtering by human ratings, feedback, and expected output can be valuable in these cases, allowing for deeper insights and quality control.
  • Filtering by Failed Metrics: As discussed earlier, this filter lets you focus on responses that didn’t meet performance criteria based on your evaluation metrics, providing an entry point for human reviewers.

The ability to filter through thousands or even millions of responses is incredibly powerful. It allows you to focus on the responses that matter most — the ones causing issues — and use these insights for further development.

Automated Evaluations

While tracking each user input and LLM response pair is essential, it’s impractical to have human evaluators or domain experts inspect and provide feedback on every single response. In fact, the average chatbot conversation spans about 10 messages. With 2,000 active users per day, that’s 20,000 monitored responses daily!

This is where automated evaluations come in. They quickly identify failing responses so human reviewers can focus on those that truly need attention, saving time and effort.

Production vs Development LLM Evaluations

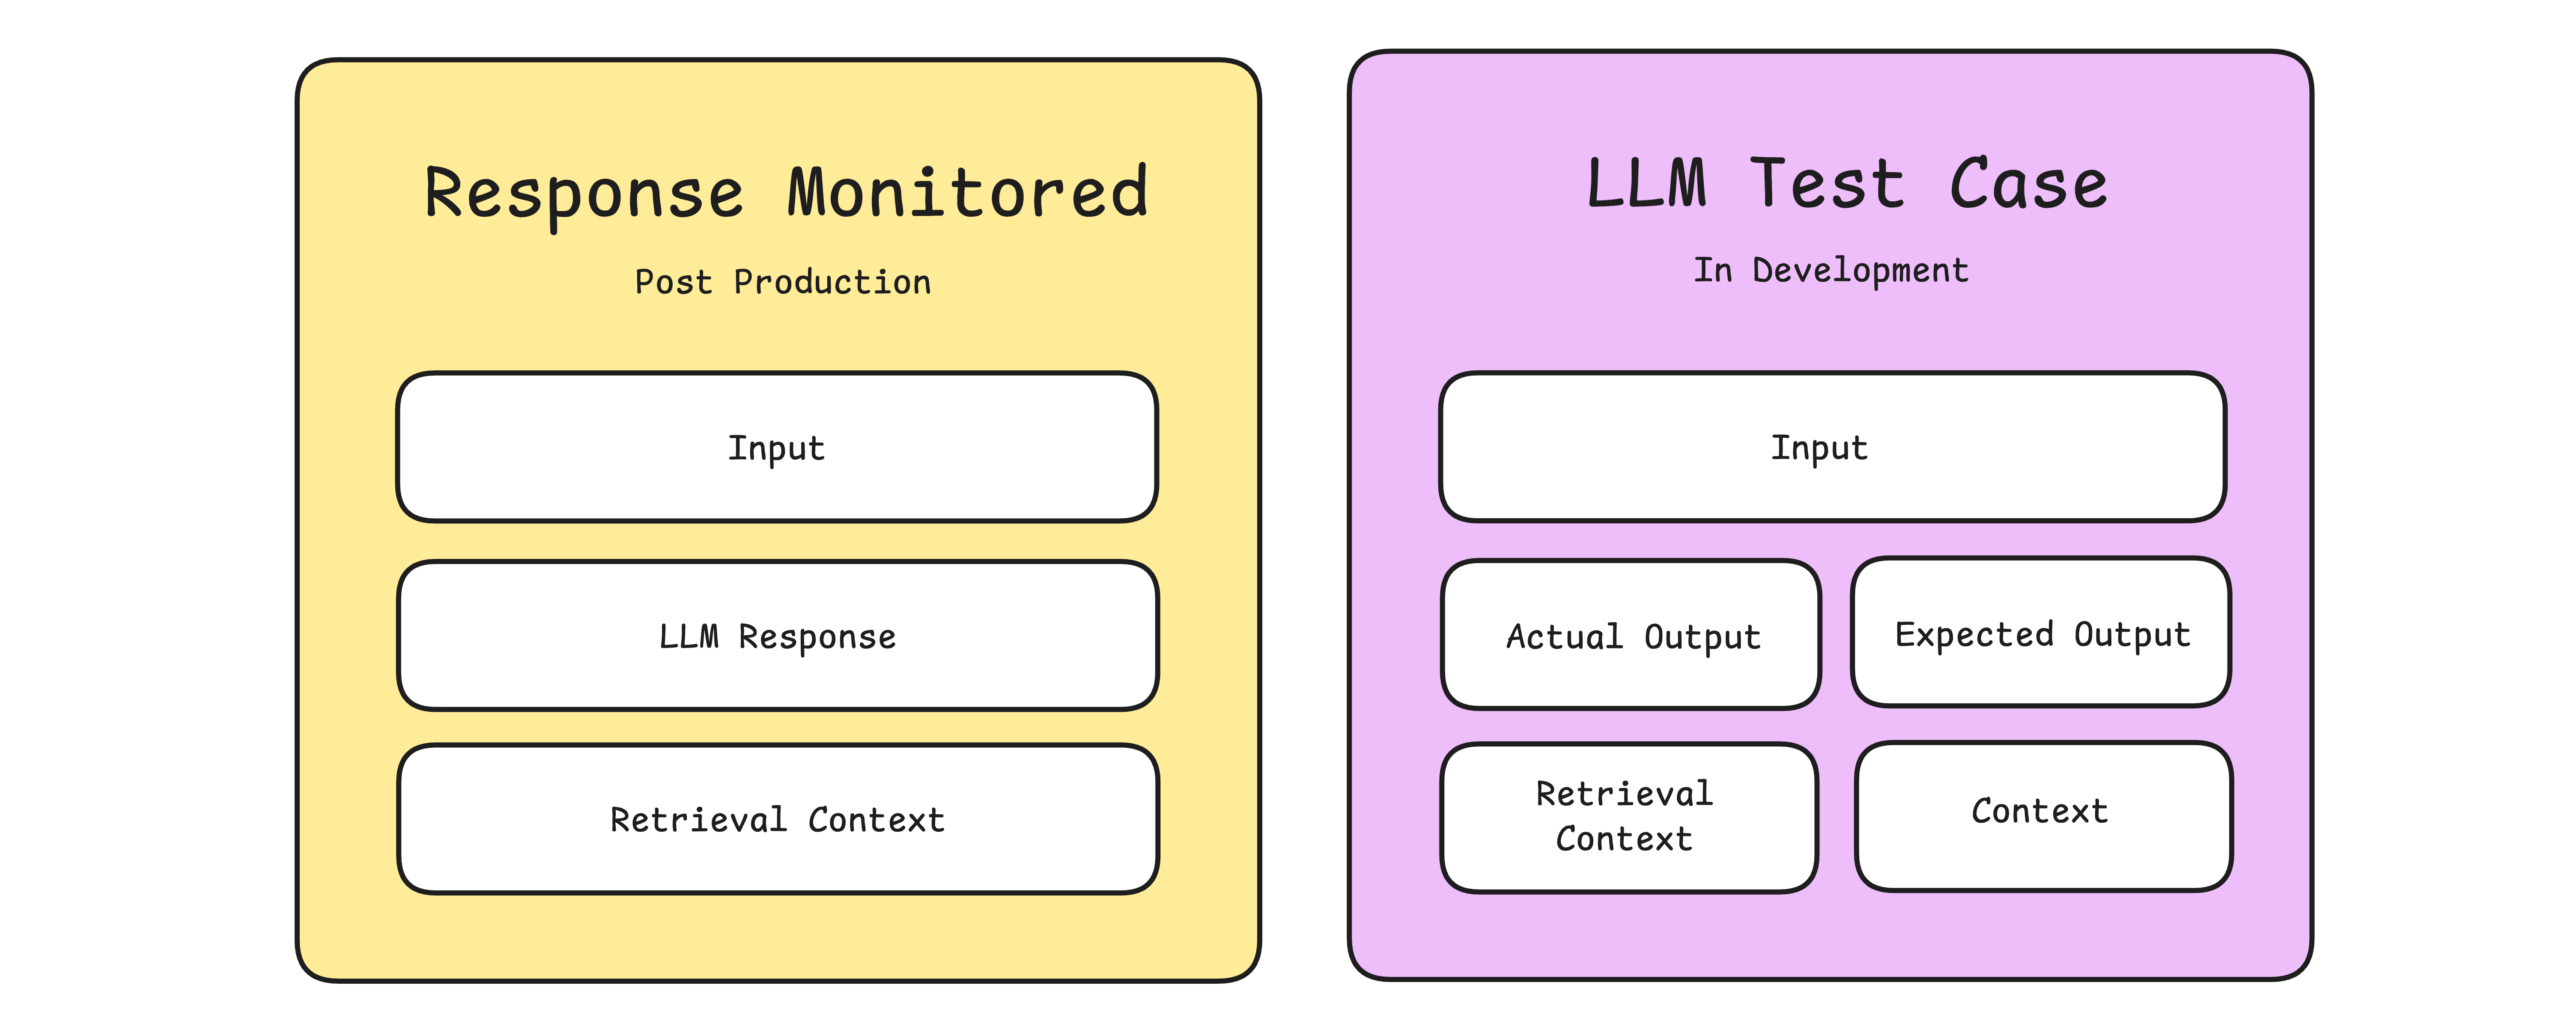
In development, evaluation test cases can include optional, human-prepopulated parameters such as expected outputs and expected retrieval contexts, enabling metrics like answer correctness that rely on these known references. (Here’s a great article on LLM evaluation metrics specifically for development-stage evaluations.)

In post-production, however, evaluations are conducted in real-time without expected outputs and expected retrieval contexts, which means that reference-dependent metrics like Answer Correctness aren’t feasible in a live setting. Nonetheless, RAG metrics such as answer relevancy, contextual precision, contextual recall, contextual relevancy, and faithfulness do not strictly require ground-truth references and remain invaluable for real-time evaluations. Additionally, customizable metrics like G-Eval, which allow you to define custom evaluation criteria, are essential for automated evaluations beyond RAG.

When you use Confident AI as your LLM observability solution, you'll get access to state-of-the-art LLM evaluations to accurately flag for failing LLM responses. Either way, having an advanced filtering tool to catch these flagged responses is essential, and we’ll be discussing this in the next section.

LLM Application Tracing

Application Tracing is crucial for LLM observability, enabling you to track an input’s progression through your system’s components, akin to tracing in Python debugging. This visibility allows you to see how an input is transformed into an output, clarifying each step from the initial request to the final LLM generation.

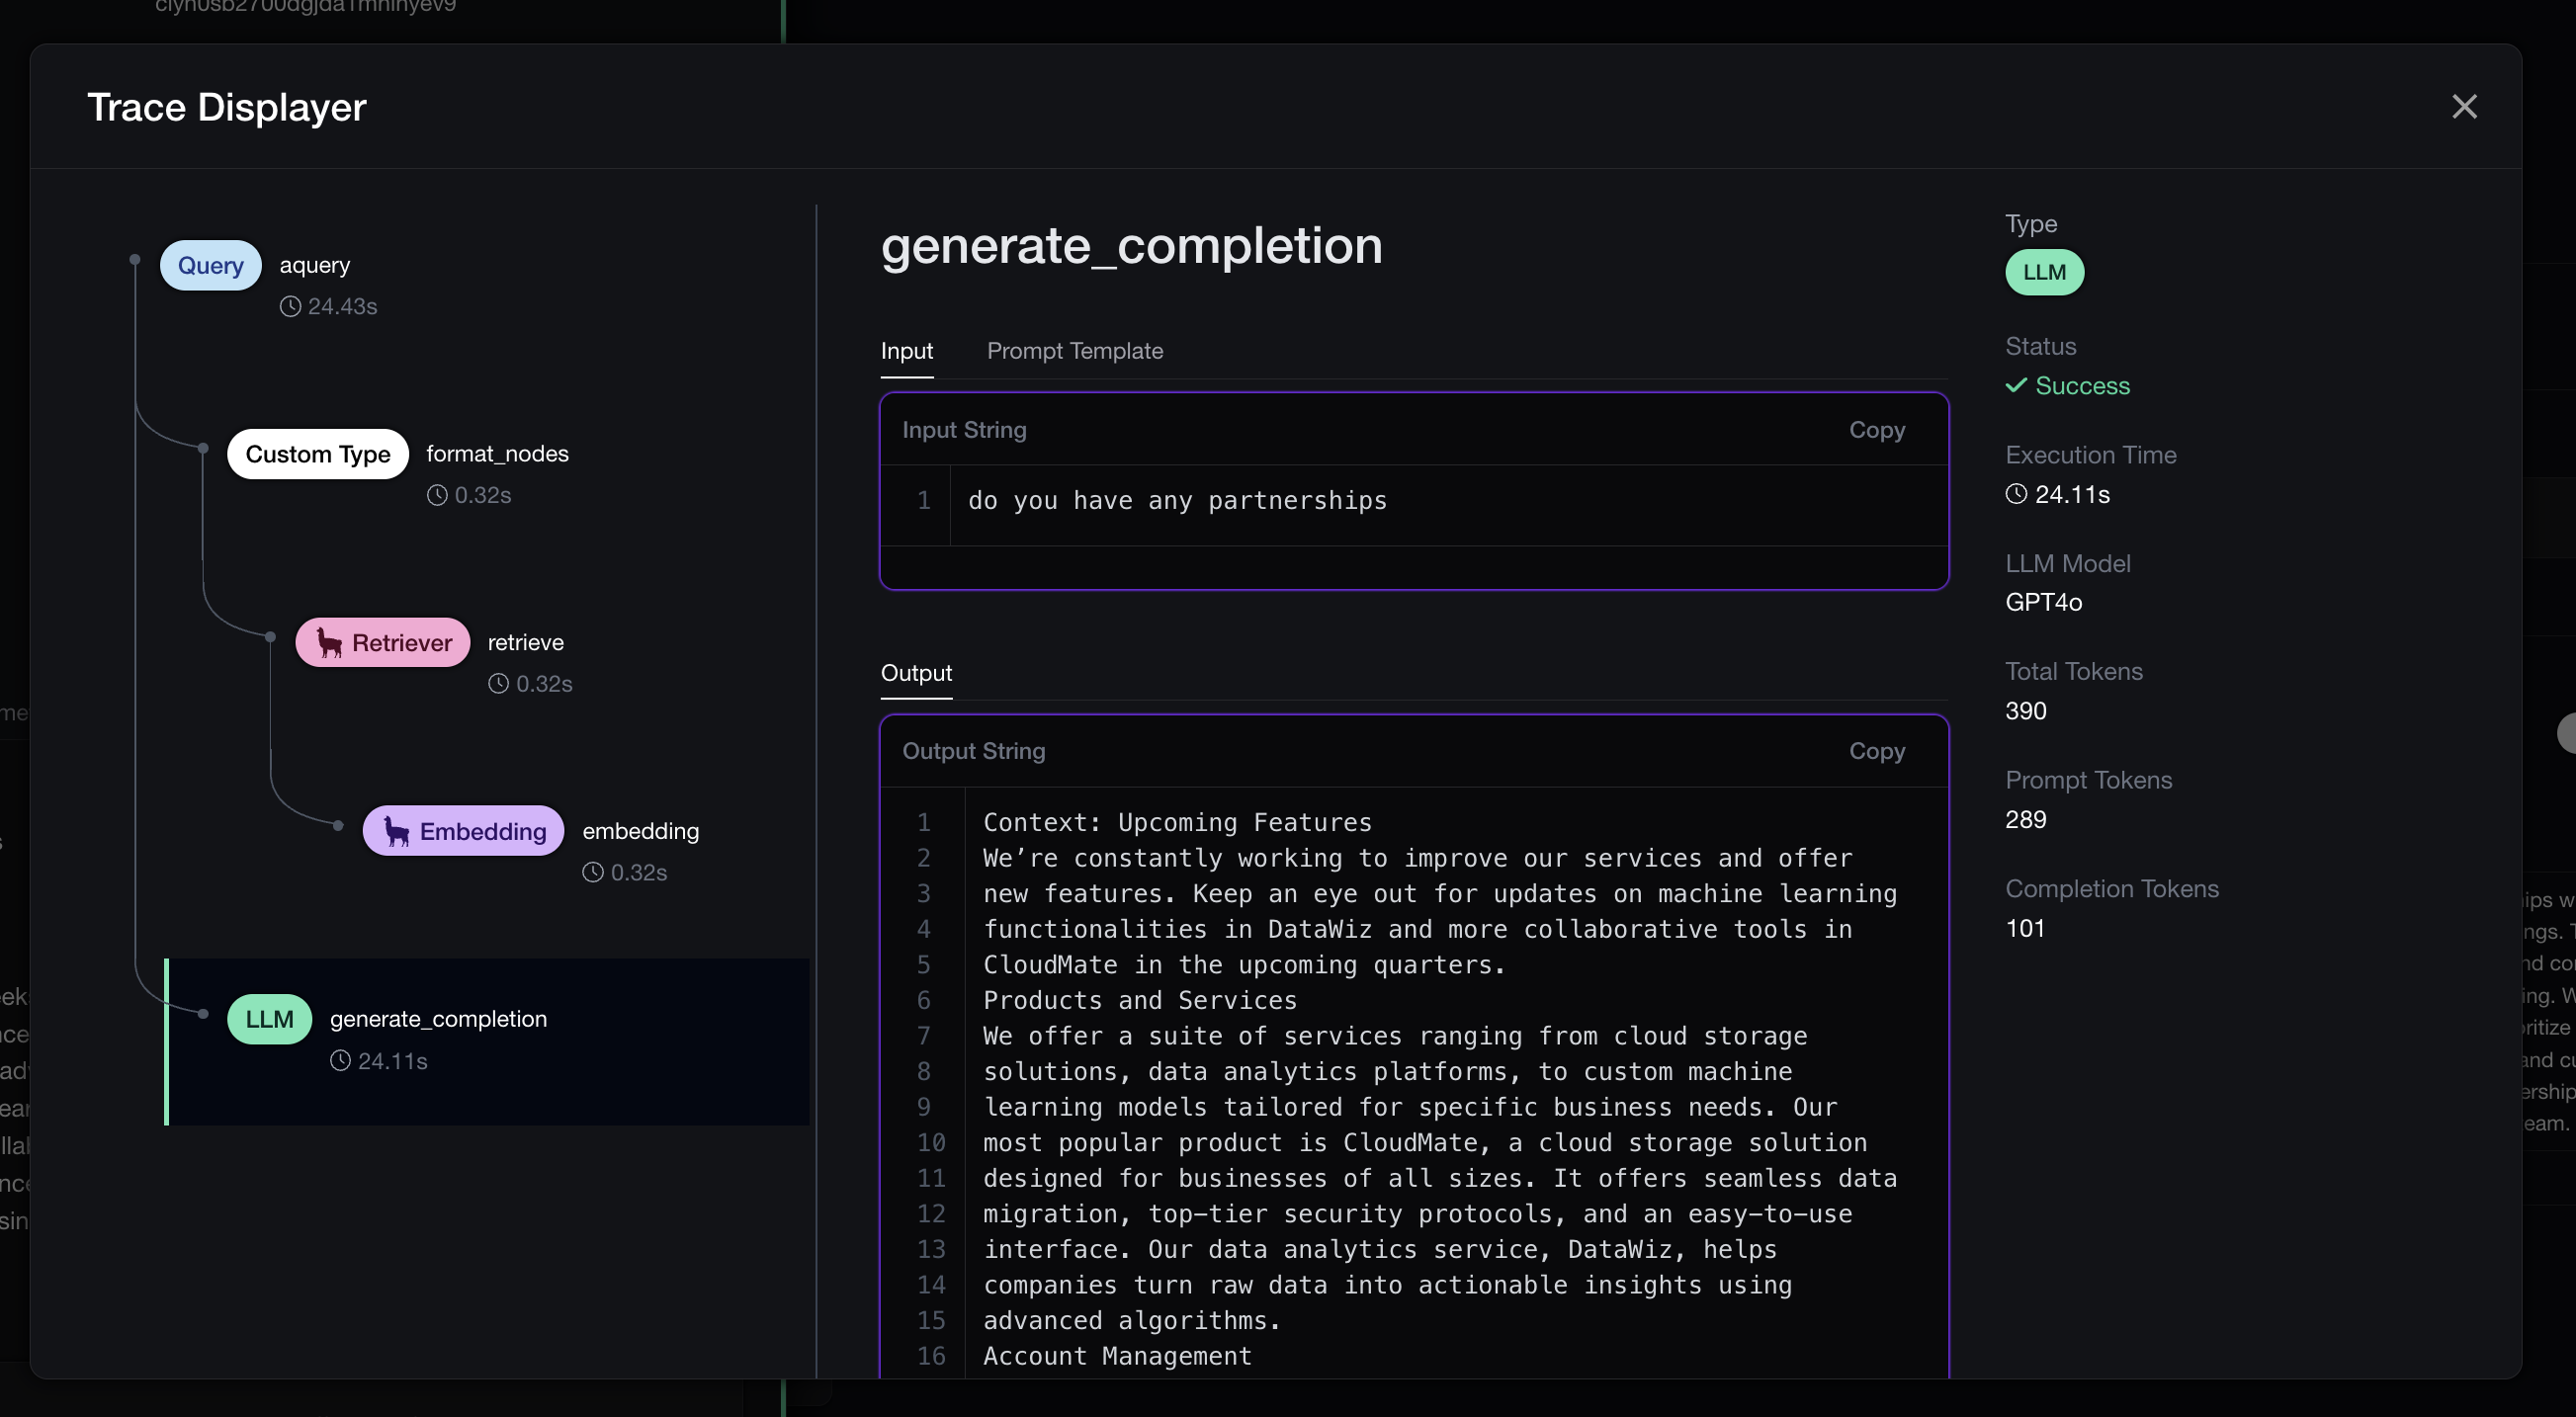
What End-to-End LLM Tracing Looks Like

LLM applications depend on multiple components, such as embedding models and retrievers. Tracing is vital for revealing if these components slow down the LLM or affect its accuracy. It ensures features like retrievers are functioning correctly and helps identify performance bottlenecks or accuracy issues. Tracing also allows you to test different models, like switching to a more cost-effective reranker, to see any performance impacts. Examining traces from failing test cases is crucial for diagnosing their failures.

If you would like some terminology, each pill you see in the image above is called a span (representing individual components like embedders, retrievers), and multiple spans make up a trace. Ultimately, tracing provides crucial visibility into how system components interact, aiding in troubleshooting, optimization, and understanding their impact on LLM performance and accuracy. Without it, you lack insight into the essential dynamics of your system.

(PS. Confident AI offers 1 line integrations with popular frameworks like LlamaIndex and LangChain, so any user of these frameworks can setup tracing in under 5 minutes.)

Human-in-the-Loop

We’ve discussed human feedback extensively in the context of automated evaluations and filtering. Let’s first define the types of human feedback. Human feedback comes in two forms:

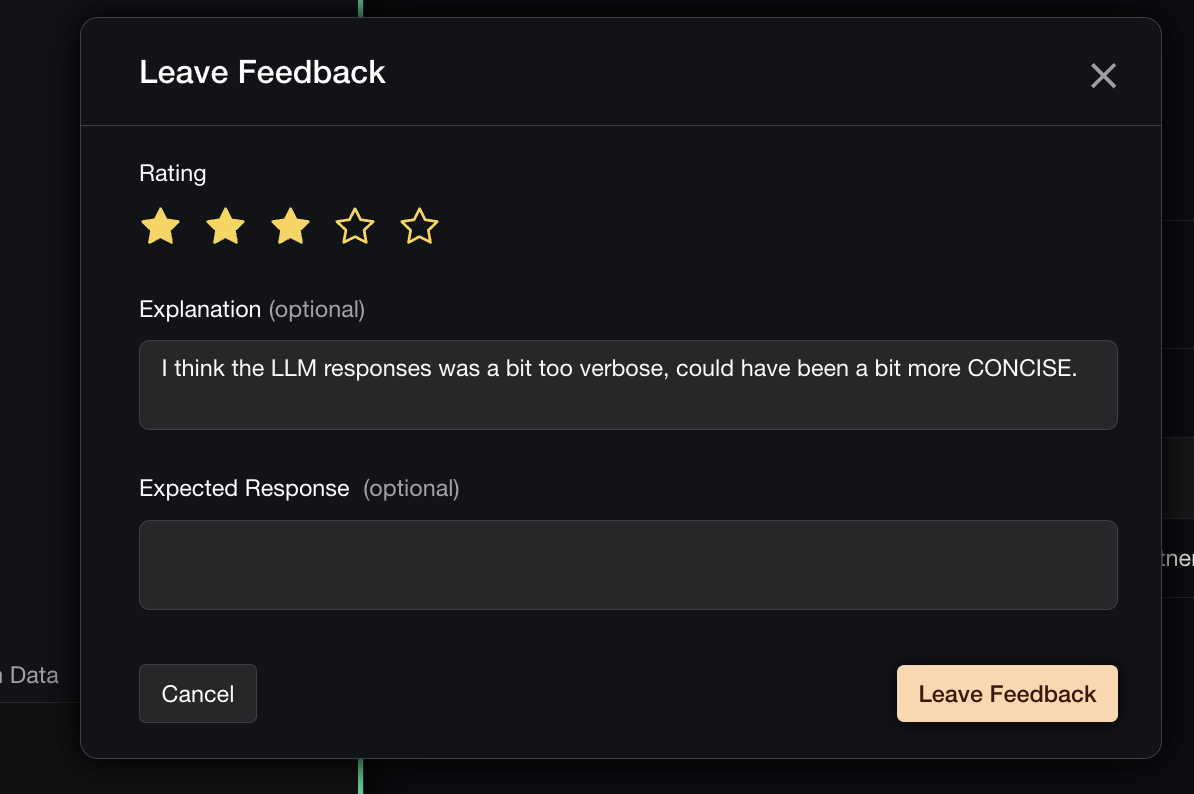
  1. User-provided feedback: this is obtained from users interacting with your LLM application. Although this feedback is abundant as less costly, it can be noisy, containing irrelevant or subjective opinions. Employing simple mechanisms like thumbs up or thumbs down ratings helps filter this noise, allowing users to provide straightforward feedback efficiently.
  2. Reviewer-provided feedback: this on the other hand, originates from domain experts, engineers, or those involved in the application’s development and management. This feedback is more targeted and insightful, focusing on specific issues such as failing evaluation metrics or problematic user or conversation IDs. However, reviewer-provided feedback is also more costly and time-consuming.
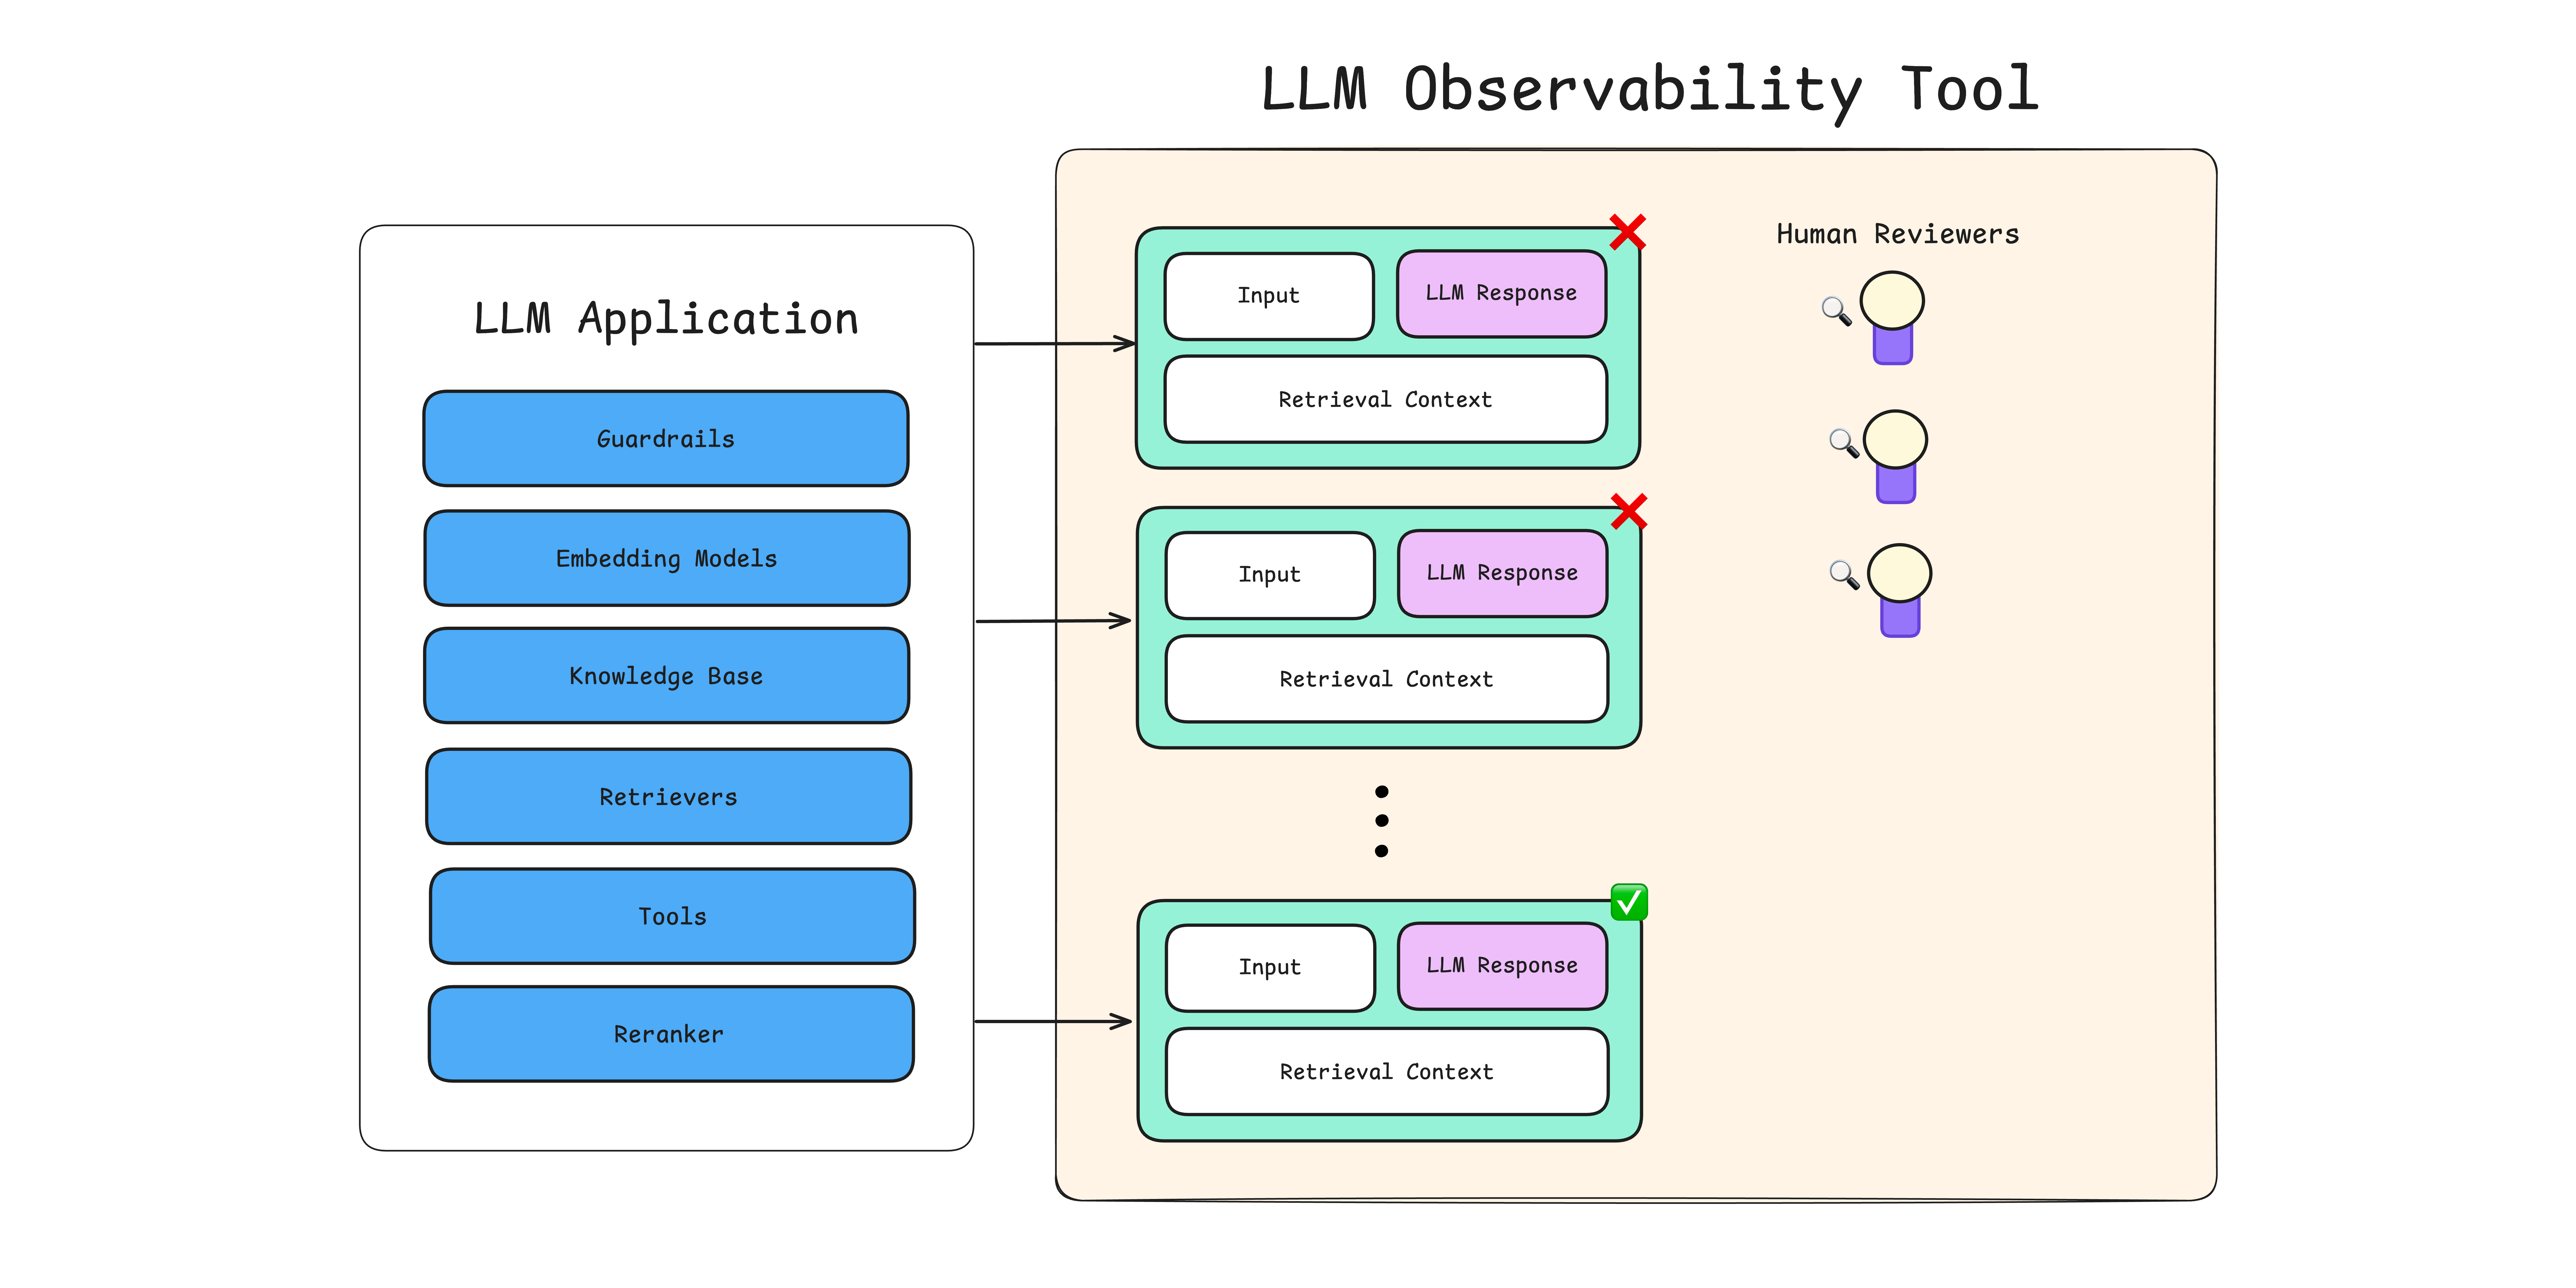
Human-in-the-loop for LLM responses in production

The primary goal of human feedback is to accurately identify failing test cases for inclusion in future evaluation datasets. While automated evaluations provide a useful filtering mechanism, human feedback remains the gold standard for precision.

This final step helps pinpoint which areas of your LLM need improvement, whether through prompt adjustments or model fine-tuning. For a clearer diagnosis of improvement areas, revisit the tracing section to identify the specific component causing issues.

How to Setup LLM Observability?

Believe it or not, setting up observability is extremely simple, especially if you're using Confident AI. All it takes is 1 API call per response, and it runs async in the background to not increase your latency. Here's an example:


import deepeval

# At the end of your LLM call,
# usually in your backend API handler
# A RAG LLM Observability example
deepeval.monitor(
    event_name="CS Chatbot",
    model="gpt-4",
    input="What are your return policies",
    response="Our return policy is...",
    retrieval_context=["A list of retrieved text chunks for RAG"],
    conversation_id="your-conversation-id",
    hyperparameters={"temperature": 1},
    additional_data={"Knowledge Base": "Production File Sources"}
   	...
)

In this example, we're logging everything in 1 API call, including any custom hyperparameter and additional data you may have. In this example, we logged that we are generating responses with a temperature of 1, and the knowledge base being "Production File Sources". Frankly, I'm not sure whether people actually name their knowledge bases, but the point is a few simple lines of code would allow you to search and filter for it on Confident AI, to recreate the scenario and context in which these responses were generated in. This is perfect for A/B different configurations.

You can view the full docs here.

Conclusion

Today, we covered the essentials of LLM observability, focusing on five pillars: response monitoring, automated evaluations, advanced filtering, tracing, and human feedback. We discussed how these pillars connect, from monitoring responses to identifying and diagnosing failing test cases, and adding them to the evaluation dataset for continuous LLM improvement.

Confident AI streamlines this entire process into a few lines of code and offers a comprehensive suite of tools for end-to-end LLM monitoring and observability. It also enables you to add failing test cases to datasets and provides unit testing capabilities to enhance model development. This all-inclusive approach ensures full visibility into your LLM application, and you can try now for free.

If you want to explore LLM observability as a solution in depth, book a call with me, I'll show you Confident AI and how it is 10x better than what you've seen so far. If you found this article useful, stay tuned to be updated on our latest observability features!

* * * * *

Do you want to brainstorm how to evaluate your LLM (application)? Ask us anything in our discord. I might give you an “aha!” moment, who knows?

Confident AI: The LLM Evaluation Platform

The all-in-one platform to evaluate and test LLM applications on the cloud, fully integrated with DeepEval.

Regression test and evaluate LLM apps on the cloud.
LLM evaluation metrics for ANY use case.
Real-time LLM observability and tracing.
Automated human feedback collection.
Generate evaluation datasets on the cloud.
LLM security, risk, and vulnerability scanning.
Kritin Vongthongsri
Cofounder @ Confident AI | Empowering LLM practitioners with Evals | Previously AI/ML at Fintech Startup | ML + CS @ Princeton

Stay Confident

Subscribe to our weekly newsletter to stay confident in the AI systems you build.

Thank you! You're now subscribed to Confident AI's weekly newsletter.
Oops! Something went wrong while submitting the form.